
DataLyzer® Spectrum - Detector
Stand-Alone Software
USER ORIENTED
Fill out one simple form to define variables to be charted.
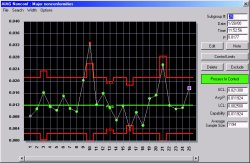
Enter data and see corresponding points plot on the graphs instantly (real-time).
Collect data from one characteristic after another or collect all characteristics at once using "by part" sequencing.
Variable and attribute charts can be conveniently sequenced together during data collection.
Document process problems using predefined 60-character cause or corrective action notes; pareto these notes as they accumulate in the file.
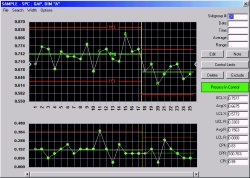
Scroll through points on the displayed graphs to review or edit your data. Click any point on the graph to view subgroup raw data and traceability information.
Store unlimited sets of stepped control limits to track recurring process shifts. Stop and restart control limits by accessing a screen button labeled "CL Set" with a mouse or hot key.
Use robust math functions to preprocess data as it is plotted in real time. Derive entire subgroups automatically from data collected elsewhere in the collection sequence.
Operators can access user-defined measuring instructions for directions about measuring the products being charted.
Searchable help is available throughout the package.
Easy connection to Detector CONTROLLER using standard RS-232 interface.
INTUITIVE ANALYSIS
DataLyzer® Spectrum will calculate control limits automatically or the user can set control limits manually.
Detailed process shift and stratification analyses detect subtle process shifts and nonrandom conditions within control limits.
Real-time statistical indicators show more than 20 alarm conditions in red, green, yellow, and other color flags.
Click [Exclude], [Delete] or [Search] to limit data for analysis.
Store unlimited numbers of traceability parameters with the subgrouped data to filter specific conditions during analysis.
REPORTS
Easy-to-read reports contain numerous, user-selectable fields and other features, allowing you to tailor information to suit your needs and auditor requirements.
8.5" x 11" report formats contain header, graphs, and data for convenient analysis, faxing, and filing. Customize report titles and include your company name in the masthead.
Analyze specific subsets of data using the [Search Data] screen button and parameter filters.
Present your valuable data in twenty unique report formats.
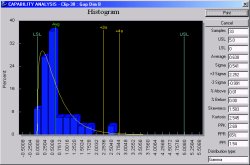
Reports include all industry standard statistics like Cpk, Ppk, and Ppm.
Easy batch reporting automates printing for recurring sets of reports.
Through ODBC access you can create your own reports using the DataLyzer® Spectrum database.